

The Syracuse men’s basketball team produces more NBA draft picks beyond what would be expected given the rankings of incoming recruits than any other team in the country. SU is followed by UConn, Kentucky, Kansas and UCLA. Duke ranks all the way down at No. 78.
I can hear you saying, “Wait, Duke has produced more than 20 draft picks in that time – how could that be?”
When basketball programs are recruiting high school blue chippers, it’s a big selling point to talk about how many players from the school have been picked in the NBA Draft. But most of the time the total number of draft picks a school produces is more a product of the recruiting talent than how well the school “develops” the player.
For example, a school like Kentucky that recruits mainly five-star players should be expected to produce many NBA Draft picks, regardless of how well John Calipari coaches. That’s not a knock on Coach Cal. It’s just reality. The baseline talent matters.
If five of the top 10 high school recruits decided to go to Alabama A&M (which finished 2-27 last year), you would expect Alabama A&M to produce some NBA talent next year. But you wouldn’t say A&M coach Willie Hayes suddenly turned into a master player developer. Just like if I talked to Steph Curry about jump shooting and he went and made 30 shots in a row it wouldn’t make me a great shot coach.
So how do we separate out the talent a school recruits in order to determine the true value the coaches and program bring to the players?
I matched data from the RSCI, a composite of the top high school recruiting rankings, to the results of all NBA Drafts since 2006 (the first year of the one-and-done rule). From these 11 years of data, I was able to calculate the chance of getting drafted at some point in a player’s college career as a function of the player’s ranking in high school. The results are shown in the chart below:
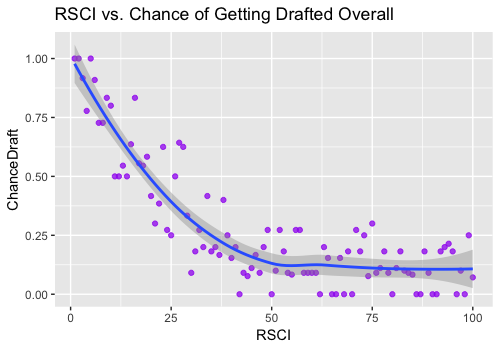
The chances of getting drafted decline from essentially 100 percent as the top-ranked recruit to just 13 percent at No. 50. Outside the top 50, being a higher ranked recruit doesn’t help your chances of making the NBA.
» Related:Tyler Lydon on adjusting to Denver Nuggets, Syracuse career, Boeheim staying
Using the regression model shown in the trend line on the chart above, I calculated the percentage likelihood of getting drafted for each player in the RSCI top 100 since 2006. I also calculated the likelihood of players getting drafted who are outside the top 100.
We can calculate the total expected number of draft picks for each college team by adding the likelihoods of the individual players together. If a school recruits four players whose high school talent level indicates 50-50 odds of making the NBA, the team’s expected number of draft picks is two. This is the team’s baseline.
We can then compare this baseline for each team with the actual number of NBA picks the team has produced. This gives us a metric for picks above or below a team’s baseline level of incoming talent. To take into account even the likelihood of every player on each team, even if the likelihood is exceedingly small because they were not ranked coming out of high school, I assumed all schools had full 13-scholarship rosters and calculated the odds of any given player outside the top 100 making the NBA at about 1 in 10,000.
The top 5 and bottom 5 schools are shown in the table below.
| Rank | School | Top-100 Recruits | Expected Draft Picks | Actual Draft Picks | Total Drafted Above Expectations |
| 1 | Syracuse | 27 | 6.86 | 16 | 9.14 |
| 2 | Connecticut | 22 | 4.97 | 14 | 9.02 |
| 3 | Kentucky | 44 | 25.08 | 34 | 8.92 |
| 4 | Kansas | 32 | 12.17 | 21 | 8.83 |
| 5 | UCLA | 27 | 10.18 | 19 | 8.82 |
| 85 | St. John’s | 12 | 1.29 | 2 | 0.71 |
| 86 | Villanova | 19 | 4.30 | 5 | 0.70 |
| 87 | NC State | 19 | 4.31 | 5 | 0.69 |
| 88 | Alabama | 15 | 2.16 | 2 | -0.16 |
| 89 | Miss. St. | 16 | 2.64 | 2 | -0.64 |
But simply getting drafted isn’t everything. The pick number is also important. The top pick in the draft makes more than $5 million while those in the second round are salaried at less than $1 million.
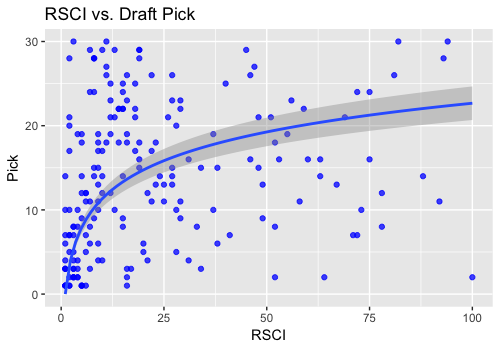
But placement in the draft is not as easy to model. There is certainly a relationship between RSCI ranking and draft pick number, but only in the top 30 picks, as shown below.
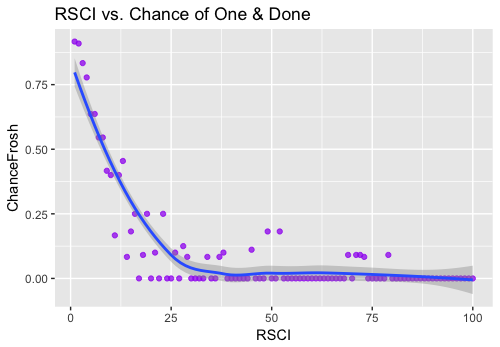
An additional factor is that the expected draft pick number of a player coming outside of high school is heavily dependent on whether the player is one-an-done or stays in school multiple years. To account for this, I first had to create a model to determine the likelihood of a player getting drafted in each year after high school. The chart below showing the likelihood of going one-and-done based on RSCI is one example.
I then created a regression model predicting draft pick number for one-and-done’s, two-and-done’s, three-and-done’s, and four-plus-and-done’s based on their RSCI. The results of the one-and-done and two-and-done models are below:
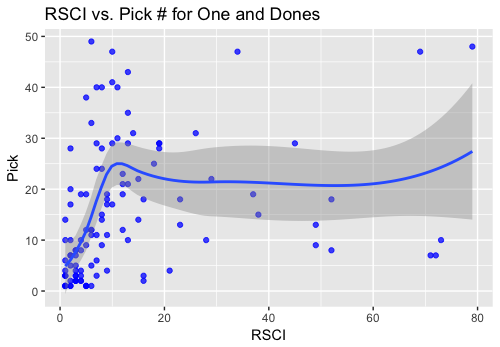
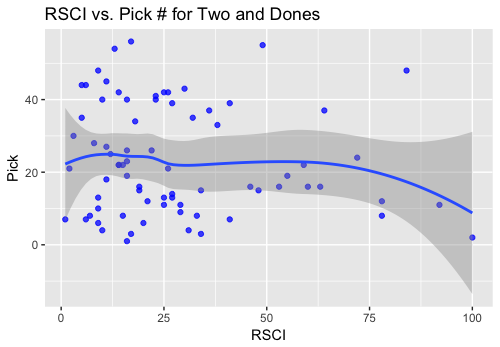
You can see that a top-10 RSCI improves a player’s expected draft pick number for one-and-done’s, but once a player has stayed two years in college his high school ranking has minimal predictive value for his place in the NBA Draft.
By multiplying the expected pick number for each year out of high school by the likelihood of getting picked in that year, I created a weighted expected pick value for each year a player is out of high school. By adding these together, I calculated an expected draft pick number for each player weighted by the likelihood that player will be drafted in each year.
We can then take the actual draft pick number of that player (for undrafted players I assigned a value of 61), and calculate whether each individual player exceeded his expected draft pick or not.
For example, Tyler Lydon, who was ranked No. 72 in the 2015 RSCI, exceeded his expected pick of 59.4 by 35 spots when he was selected by the Denver Nuggets this past year. Donte Greene, on the other hand, came in ranked No. 7 in the RSCI and so had a predicted pick of 30.3. (If this seems high to you, remember this metric is accounting for the possibility he goes undrafted.) Greene ultimately went one-and-done but only exceeded his expected pick by 2.2.
Similar to how we were able to add the expected draft picks for each college team together to produce a total baseline of expected picks, we can add together the metric comparing the difference between actual pick and expected pick for each college team. Syracuse does not fare quite as well in this metric but still ranks in the top four and highest in the ACC. In the table below, negative numbers are better.
| Rank | School | Players Drafted | Cumulative Pick # vs. Expected | Average Pick # vs. Expected |
| 1 | Kansas | 21 | -570 | -27 |
| 2 | Kentucky | 35 | -460 | -13 |
| 3 | Washington | 12 | -365 | -30 |
| 4 | Syracuse | 16 | -353 | -22 |
| 5 | Arizona | 14 | -332 | -23 |
The next time you hear about how a school is a factory for “pro development” and producing tons of NBA Draft picks, remember that what really matters is exceeding the baseline. In this measure, Syracuse is leading the pack in producing NBA talent.
For more Syracuse coverage, Like our Facebook page and follow us @TheJuiceOnline.